This is an old revision of the document!
Table of Contents
Grafana - Monitor
This documentation will be splitted in two sections, one regarding Platform related data and dashboard while the other regards Traffic Monitoring.
Generally speaking, many information in how to use Grafana and it's capabilities, refer to the following link.
Platform (BP) related Data:
The general data infrastructure is the following:
- BP Instances natively collect information about service, process and Call Diagnostics;
- BP Instances stores and delivers Data to a chosen InfluxDB Instance:
- Configuration in Service Provider section “Logging and Monitoring”;
- Data is split in “System Monitoring” and “Tenant Monitoring”;
- InfluxDB on Monitor Instance collect and organizes data;
- Grafana display and reads data;
To diplay a specific data, create a new panel and select “InfluxDB” as data source.
In the “From” parameter you can select mesasurements, many options are visible when making the selection.
The most relevant data are the following:
- “sipprocessor.trunk” as “activeCalls”: shows the number of active calls for each timeframe based on trunk, tenant and/or hostname;
- “agentserver” as “loggedAgents”: shows the number of connected agents for each timeframe based on tenant and/or hostname;
- “scenarioengine” as “activeInteraction”, “activeVoiceInteraction” or “activeChatInteraction”: it shows the number of interactions flowing in the scenario (Connect Call/Chat blocks included) for each timeframe, based on tenant and/or hostname;
- “rtpprocessor.voice”: generally, you can find data related to voice call quality (latency, jutter, etc.);
Traffic Monitoring Data
The general data infrastructure is the following:
- Billing data is saved in MongoDB;
- The script of the monitorTraffic Data is located in the /home/centos/monitorTraffic folder, in the application “app5.js” the script collects the data from Mongo (every hour from a cronjob - called query5.sh) and saves the retrieved data in the machine's MySQL database (generalTable_Five);
- Another script in the same instance is calculate.js, it processes the retrieved data and calculates the cost per each customer, storing the data into another table called (calculations);
- Grafana, reads and displays the data taken from the “calculations” table, on the “Traffic Situation” dashboard with alerts.
- Alerts in “Traffic Situation” dashboard are configured as follows:
- When the threshold is reached, an automatic mail will be forwarded to Admin and Voice Traffic;
- For some customers, an API is invoked (monitorWebhook) in order to send an email to some customers mail addresses, you can find this data on the machine, just access in SSH to the following path /home/centos/monitorWebhoook and add another line in the JSON array if you have to add a new one;
- Alert threshold can be changed directly from the dashboard:
- On the panel, click on “Edit”;
- Head to the “Alert” section;
- Change the “Conditions”;
- Change, at the bottom, “threshold”;
- The other field at the bottom “company” need to be left alone as the “Customer Name” in the “monitorWebhook”;
- Internal mail addresses must be changed from the “Alert” section of Grafana:
- Left-side bar –> Alerting;
- Notification channels;
- Internal mail;
- Change “Addresses”;
Upating Traffic Monitoring Data
Every month, once the “official” traffic reports are available, it is needed to update scripts and dashboard in order to aligh them with the “official” reports. In addition, it is required to update the dashboard each time a customer “recharges” its credit.
It is suggested to keep track of everything through a local file, for this option, there's the following link.
Monthly Update
- Login to the Traffic Situations;
- Access to the Alerts tab and stop the alerts temporarily to avoid sending unwanted mails to the customers;
- Go back to the Traffic Situations and update each panel (one for each customer) with the official values in the variable fields (at the end save the dashboard for each customer for safety);
- Additionally, “calculate.js” script needs to be updated as well:
- Login via SSH to the Monitor Instance;
- Modify the “month” variable on line 25 of “calculate.js” in the /home/centos/monitorTraffic folder;
- Save and run the application (do node calculate.js);
- Once you have updated both “Traffic Situation” dashboard and “calculate.js”, reactivate alerts in the same way you have stopped them.
Recharge Update
- Login to the Traffic Situations;
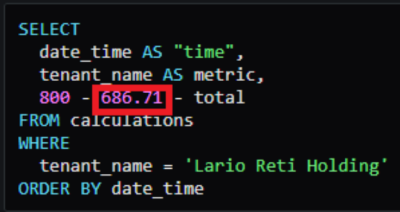
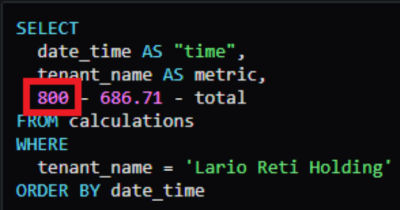
- Inside of the customer's panel you're updating, change the credit value:
- Save the dashboard, the alert goes back to OK after a couple of minutes.
Add new tenants on the dashboard
To be able to add a new tenant on the dashboard of the monitor you must first login on the monitor DB and insert a new tenant, this process will be adapted by the monitor but
an SQL query must be done first.
By accessing to a DB application, you must run this command on the “calculation” table:
INSERT INTO calculations (tenant_name, date_time, total) VALUES (‘TENANT’*, '2023-03-23 12:00:00', 0)
Be aware to change tenant_name to the one you're trying to add, ocne you've inserted the tenant under the calculation table, the tenant is added on the monitor environment.
After, you must duplicate an existing Dashboard from the Monitor, modify the credit and the tenant_name as previously specified with the same name you had gived to the sql statement, if there's a threshold you can addi it by navigating to the “Alert” tab and inserting the values, a common condition is:
WHEN LAST() OF query( A, 1m, now) IS BELOW (threshold)
Then, you have to add the calculation query on the “calculate.js” file located in the /home/centos/monitorTraffic folder. By doing so, you have to add a new line under the existing customer, feel free to use this template as an example:
// tenant_name
query="SELECT (SUM(CASE WHEN direction = 'outbound' AND (dest_number LIKE '3%' OR dest_number LIKE '00393%') THEN IFNULL(duration, 0) * 0.0350 / 60 ELSE 0 END) + SUM(CASE WHEN direction = 'outbound' AND (dest_number LIKE '0%' OR dest_number LIKE '00390%') THEN IFNULL(duration, 0) * 0.0130 / 60 ELSE 0 END)) AS total FROM generalTable_five WHERE call_start > '"+month+" 00:00:00' AND tenant_name = 'tenant_name' AND billing_provider LIKE 'Irideos%'";

queryArray.push(query);
tenant="tenant_name";
tenantArray.push(tenant);
Change the tenant_name with the one you've been given and the query as well. The query provided on the example is referred to only outbound traffic using the standard rates.
Therefore, run calculate.js by doing node calculate.js and everything will be Up&Running.
— Antonio Andriychuk 2024/10/10 14:04


